
Session-based, packet-level visibility NetFlow can't give you
NGNTA sits passively on your network core, analyzing full packets at line rate — up to 200 Gbps — and retaining complete flow information with rich metadata for years, without the sampling, blind spots, or storage limits of NetFlow.
Passive by design. Complete by default.
A single sensor mirrors traffic from your core switch or router, analyzes every packet directly instead of relying on sampled NetFlow summaries, and streams complete, session-based flow data into a purpose-built database — no agents, no inline hardware, no sampling.
- Analyzes full packets directly instead of relying on sampled NetFlow summaries
- Retains complete flow information with rich metadata for years, without loss
- Performs real-time analysis at line rate, even on 200 Gbps+ networks
- Purpose-built database needs <0.025% the storage of full packet capture
- Deploys via a single passive tap or SPAN/mirror port — zero network disruption
From raw packets to years of searchable flow history
NGNTA is a real-time, high-performance, session-based, packet-level network traffic analytics system — built to overcome the limitations of traditional flow-based analysis.
1. Analyze Every Packet
NGNTA analyzes full packets directly instead of relying on NetFlow's summarized, sampled statistics — packets provide complete visibility, while NetFlow only provides a summary.
See why NetFlow falls short2. Retain Every Flow
A purpose-built, big-data database retains complete flow information with rich metadata for years — using less than 0.025% the storage of full packet capture, searchable in milliseconds.
See flow retention3. Detect With Precision
Session-based analysis identifies connectivity issues, retransmissions, port scans, DDoS SYN floods, server outages, and routing loops — from actual TCP behavior, not statistical inference.
See detection modulesBuilt to outperform NetFlow-based analysis
Here's the measurable difference NGNTA makes — and exactly where traditional NetFlow-based tools fall short.
200Gbps
Real-Time Packet Throughput
Kernel-bypass I/O analyzes full packets at line rate — scalable further with PCIe 5.0-based 400G NICs.
3+ Years
Flow Data Retention
Every flow retained with rich metadata — not purged after 90 days like most NetFlow-based tools.
<0.025%
Storage vs. Full Packet Capture
One appliance retains 6+ PB/month of traffic history with rich metadata in just 1.5 TB of storage.
Three pipelines, one network
NetFlow-based tools bolt load balancers, ingestion tiers, and indexing clusters onto your network just to keep up with flow volume. NGNTA replaces all of it with a single passive appliance that sees every packet at line rate.
1 NetFlow's inherent visibility limitations
2 Sampling that loses accuracy
3 Performance degradation from increased CPU, memory & TCAM usage
4 Ingestion & indexing limitations — hard caps on flows per second
1 True full visibility — packets tell everything
2 Zero packet loss — 100% accuracy
3 Minimal CPU, memory & TCAM usage — no bolt-on hardware
4 Line rate up to 200 Gbps — 8M flows analyzed per 15 seconds
High-Speed Network Device
Load Balancer
Load Balancer
Network Packet Broker
(optional)
Flow Collectors
Ingestion: 48K FPS
per flow collector
Polling Engines
Ingestion: 50K FPS
per polling engine
Elasticsearch Cluster
Indexing: min. 20–30 nodes
SQL Server
Indexing: max. 300K FPS
NGNTA
Line rate to 200 Gbps
8M flows / 15 sec
Short-term data retention & granularity
Long-term data retention & granularity — 3+ years
High cost & maintenance — many nodes to provision and manage
Low cost & maintenance — one appliance, zero external infrastructure
Challenges in NetFlow-based solutions
Here's a closer look at the four hard limits from the diagram above — the reasons NetFlow-based analysis can't meet the modern network's need for zero-loss, high-fidelity, long-term flow data.
Inherent visibility limitations
NetFlow reports source/destination IPs, ports, packet and byte counts, protocols, and ToS — but it lacks TCP sequence/ACK numbers, TCP flags, inter-packet timing, zero-window conditions, three-way handshake options, ICMP types, and other packet-level detail. See the full comparison below.
Sampling that loses accuracy
To protect device CPU and memory on 1 Gbps+ links, NetFlow is typically sampled at 1:1000 to 1:10000 on 10 Gbps+ networks. Higher sampling rates mean lower accuracy — small, low-volume, high-risk flows can disappear entirely between samples.
Performance degradation of network devices
Even with sampling reducing CPU, memory, and TCAM usage, NetFlow generation can still degrade production traffic performance when sampling rates are set too low or traffic suddenly surges.
Ingestion & indexing limitations
ElastiFlow's Advanced/Premium license caps out at 48K flows/sec per collector — reaching 200K FPS would take 20+ high-performance Elasticsearch nodes. SolarWinds NTA tops out near 300K FPS on SQL Server and, by default, applies a "95% rule" that keeps only the flows representing 95% of traffic volume — discarding roughly 96% of individual flows just to cut storage. And because NetFlow exports records in bursts (often at a 15-second minimum interval), a single export can dump ~1 million flow records at once, overwhelming the collector.
NetFlow vs. packet-level vs. session-based analysis
Here's exactly which packet-level signals each approach can see:
| Information | NetFlow | Packet-Level Analysis | Session-Based & Packet-Level (NGNTA) |
|---|---|---|---|
| IPs, ports, protocols | Yes | Yes | Yes |
| Packets, bytes | Sampled | Yes | Yes |
| Zero window | No | Yes | Yes |
| TCP retransmission | No | No | Yes |
| Duplicate ACK | No | No | Yes |
| Duplicate SYN and SYN/ACK | No | No | Yes |
| Round-trip time | No | No | Yes |
| Service ports | No | No | Yes |
| TCP 3-way negotiation | No | No | Yes |
NGNTA is the only approach that captures every one of these signals — natively, on every flow, without sampling.
Flow data retention & granularity
| No-SQL Solution | SQL Solution | NGNTA | |
|---|---|---|---|
| Data retention | 7–90 days | Hot ≤30 days, warm ≤60 days, deleted after 90 days | 3+ years |
| Data granularity | 15 sec – 1 min | 1-min up to 5 hrs; 15-min 5–48 hrs; 1-hr 2–7 days; 6-hr beyond 7 days | Traffic volume: 1 sec, with microburst (4–8ms) Flow statistics: 15 sec |
Key technical advantages
High I/O Throughput
Advanced kernel bypass technology significantly enhances packet I/O performance, handling up to 200 Gbps of traffic — scalable higher with PCIe 5.0-based 400G Ethernet cards.
High-Performance Compute
NGNTA leverages modern CPU architecture and advanced processor features, paired with optimized algorithms, to maximize computational and processing efficiency.
Session-Based & Packet-Level Analysis
Packets contain all the information necessary for analysis, and they're the foundation of NGNTA's engine. Session-based analysis unlocks that information for comprehensive network visibility.
Big-Data Database
A purpose-built database retains every flow with rich metadata on a single server — under 0.025% the storage of full packet capture, with any flow searchable in milliseconds and no external storage required.
10 capabilities NetFlow-based tools can't match
Explore each module of the NGNTA platform — from complete flow retention to on-demand packet capture.
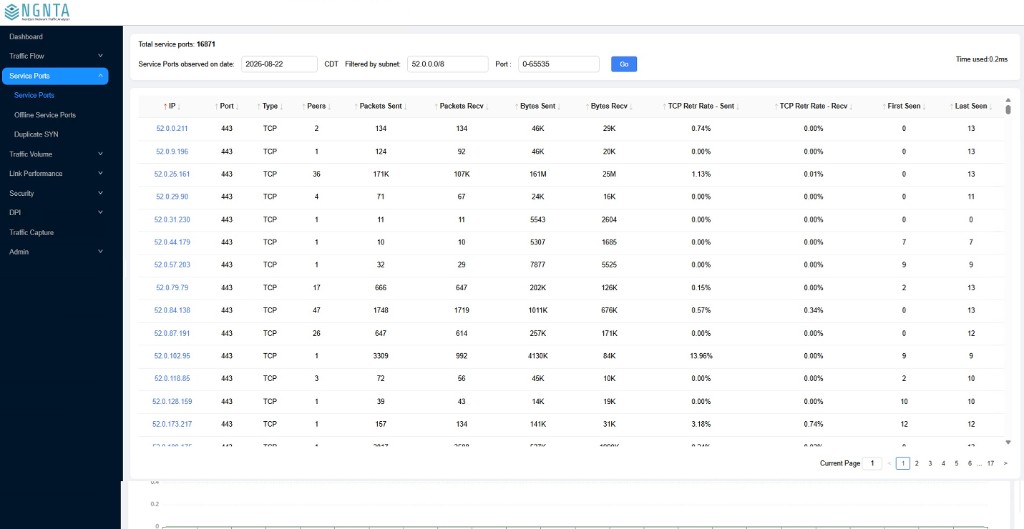
Retain complete flow information with rich metadata
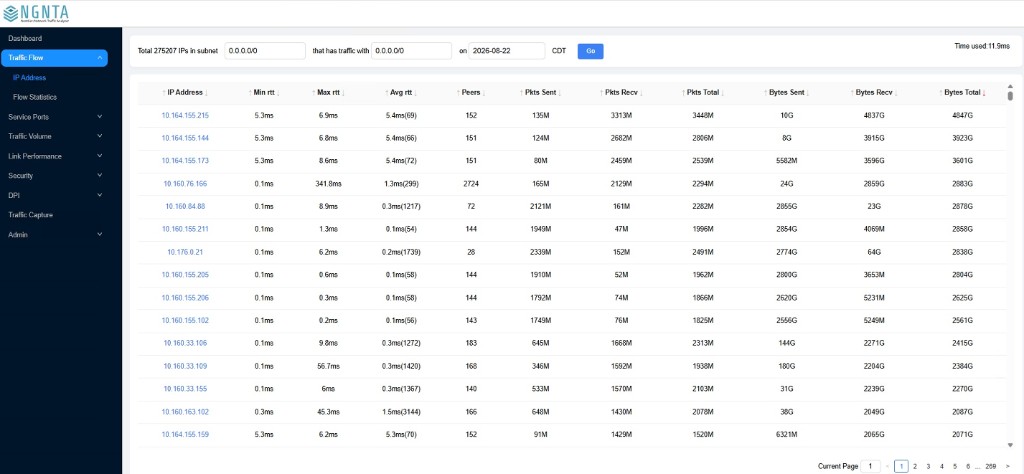
NetFlow tables cap out on TCAM resources, sampling hides flows in high-speed networks, and many tools drop metadata like client ports to save space. NGNTA combines a direct feed of full packet data with a purpose-built database to preserve complete, troubleshooting-grade flow information — for years.
- Every flow preserved individually — never merged, even with matching source/destination IP and port
- Complete communication context: every peer IP for any given host, and full flow detail between any two endpoints
- One-second bandwidth utilization with microburst detection, down to individual IPs and subnets
- Automatic service-port identification from TCP handshakes and UDP timing — no reliance on predefined port lists
Pinpoint connectivity issues & round-trip time
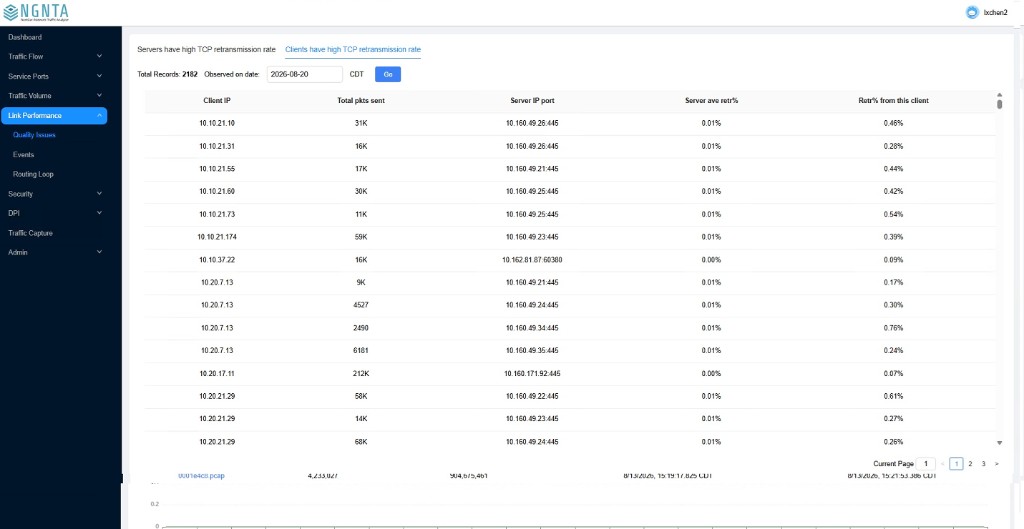
Synthetic transaction tools miss paths that load-balancing hashes and ECMP routing don't cover. NGNTA measures TCP retransmission rate on every real flow instead — a direct, continuous indicator of packet loss, congestion, and connectivity problems across the entire infrastructure.
- Per-flow TCP retransmission metrics across every monitored device and link
- Round-trip time (min/avg/max) computed from SYN/SYN-ACK, ACK, and ICMP exchanges — sub-millisecond precision
- Machine learning isolates whether latency originates in the network or on the endpoint
- Continuous monitoring from real application traffic — no synthetic generators to deploy or maintain
Detect real session behavior, not statistical guesses
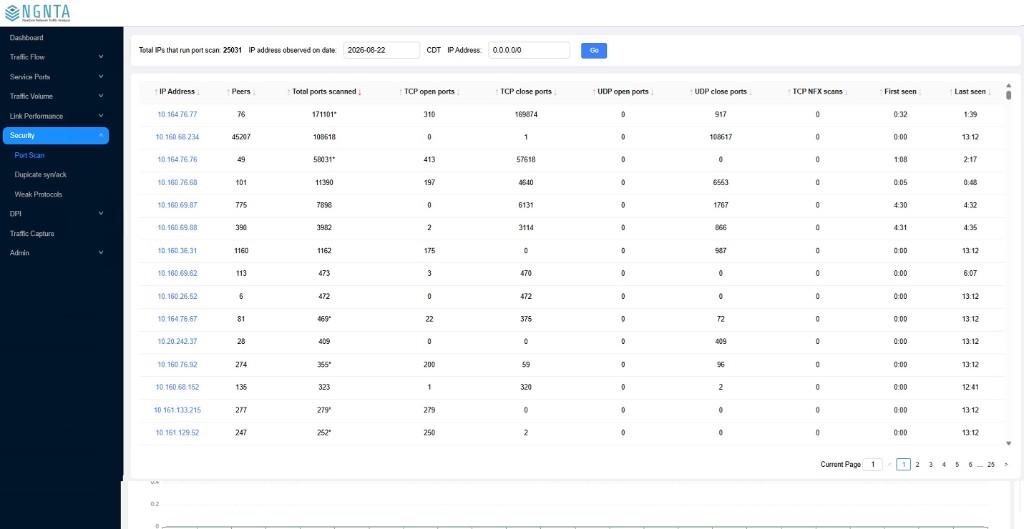
NGNTA identifies threats and outages by examining actual TCP session behavior — not inferred traffic patterns — which means fewer false positives and detection based on ground truth.
- Server out of service: repeated SYNs with no SYN/ACK, correlated against the server's own communication history
- DDoS SYN flood: per-second SYN/ACK retransmission counts per destination IP, even on a single occurrence
- Port scanning: open/closed-port scan patterns identified from session-level RST, SYN, and SYN/ACK order
- Routing loops: repeated packet-forwarding events on the same path, flagged immediately as TTL expires
On-demand packet capture, minimalist deployment
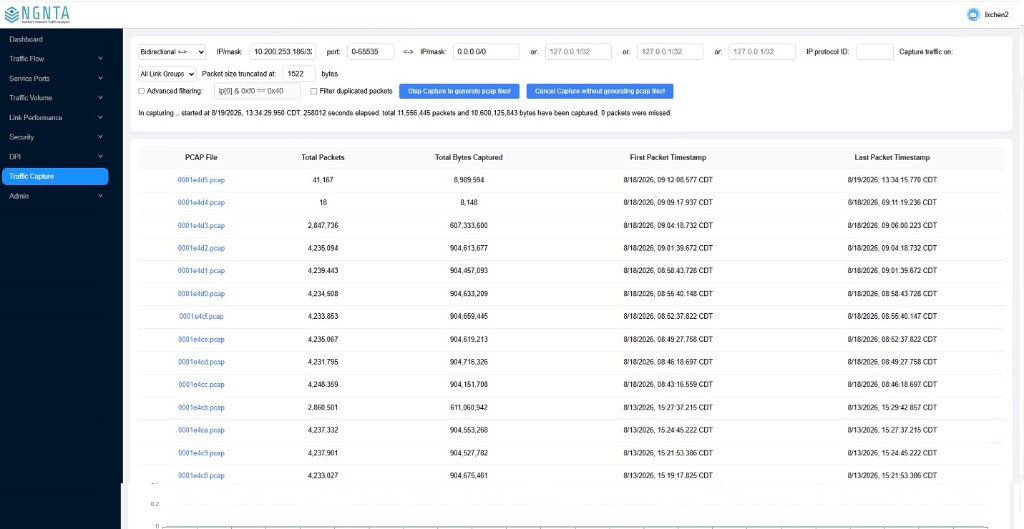
NGNTA is also a full lossless packet capture (PCAP) solution — hundreds of times faster than Wireshark or TShark — while it simultaneously analyzes every packet in real time. It connects via a passive tap or SPAN/mirror port, with no inline hardware and no scheduled downtime.
- Flexible, filterable real-time capture generating industry-standard PCAP files
- Lossless capture even on high-speed networks, for forensics and root-cause analysis
- Passive tap / SPAN-port install — no traffic path changes required
Choose the right NGNTA appliance for your network
NGNTA currently ships in three models to meet different deployment scenarios and application requirements — every model runs the full analysis engine.
NGNTA-20
Small data centers or branch offices
20 Gbps
Network throughput (2×10 Gbps)
- SFP+/SFP interfaces
- 4T storage capacity
- 96–128G memory · Single CPU
- Small factor (portable)
NGNTA-80
Medium-sized or regional data centers
80 Gbps
Network throughput (2×40 Gbps)
- QSFP+ interfaces
- 100T storage capacity
- 500G memory · Dual medium-end CPUs
- 1 RU rack mount
NGNTA-200
Large data centers
200 Gbps
Network throughput (2×100 Gbps)
- QSFP28 interfaces
- 200T storage capacity
- 1T memory · Dual high-end CPUs
- 2 RU rack mount
Need a custom configuration for a unique environment? Talk to our engineering team about a tailored deployment.
See every module working together, live
Watch a 3-minute walkthrough of the full NGNTA platform — packet-level flow analysis, connectivity monitoring, security detection, and on-demand capture in a real deployment.
NGNTA (NextGen Network Traffic Analyzer) is a real-time, high-performance, session-based, packet-level network traffic analytics system. Unlike NetFlow, which samples traffic and only summarizes flows, NGNTA analyzes full packets directly, retains complete flow information with rich metadata for years, and performs real-time analysis at line rate — even on high-speed networks.
Up to 200 Gbps of live traffic per appliance, using advanced kernel-bypass I/O to analyze full packets at line rate. The architecture scales further with PCIe 5.0-based 400G Ethernet cards for organizations that need even higher throughput.
NGNTA's purpose-built database retains complete flow information with rich metadata for 3+ years, at less than 0.025% the storage of full packet capture. For example, a single appliance can handle more than 6 petabytes of traffic per month while requiring only about 1.5 terabytes of storage to retain all flows with rich metadata.
Yes. NGNTA connects passively via a network tap or a SPAN/mirror port on your existing switch or router — it never sits inline with production traffic, so there's no re-architecture and no scheduled downtime.
NGNTA detects TCP retransmission-based connectivity issues, calculates round-trip time, identifies servers that go out of service, flags DDoS SYN flood attacks, detects open- and closed-port scanning activity, and spots routing loops — all from actual session behavior rather than inferred statistical patterns.
NGNTA ships in three models: NGNTA-20 (20 Gbps) for small data centers or branch offices, NGNTA-80 (80 Gbps) for medium-sized or regional data centers, and NGNTA-200 (200 Gbps) for large data centers. See the full specification comparison above, or talk to our team about a custom configuration.
Ready to find your NGNTA fit?
Talk to our team about your network size and compliance needs — we'll help you pick the right tier and plan a zero-disruption rollout.